

The major advantage of candlestick charts is that they provide traders information regarding changes in the value of cryptocurrency in a given time frame. The price action on candlestick charts is depicted in terms of a candle, making it easier to identify trends, reversals, or any trading opportunities. Whether you are new to trading or seasoned, knowing how to read candlestick patterns makes it possible to make educated investment choices. By reading this guide, you will be able to understand what components candlestick charts are made of and how to use them in forecasting the price or movement of cryptocurrency.
What Is A Candlestick Chart?
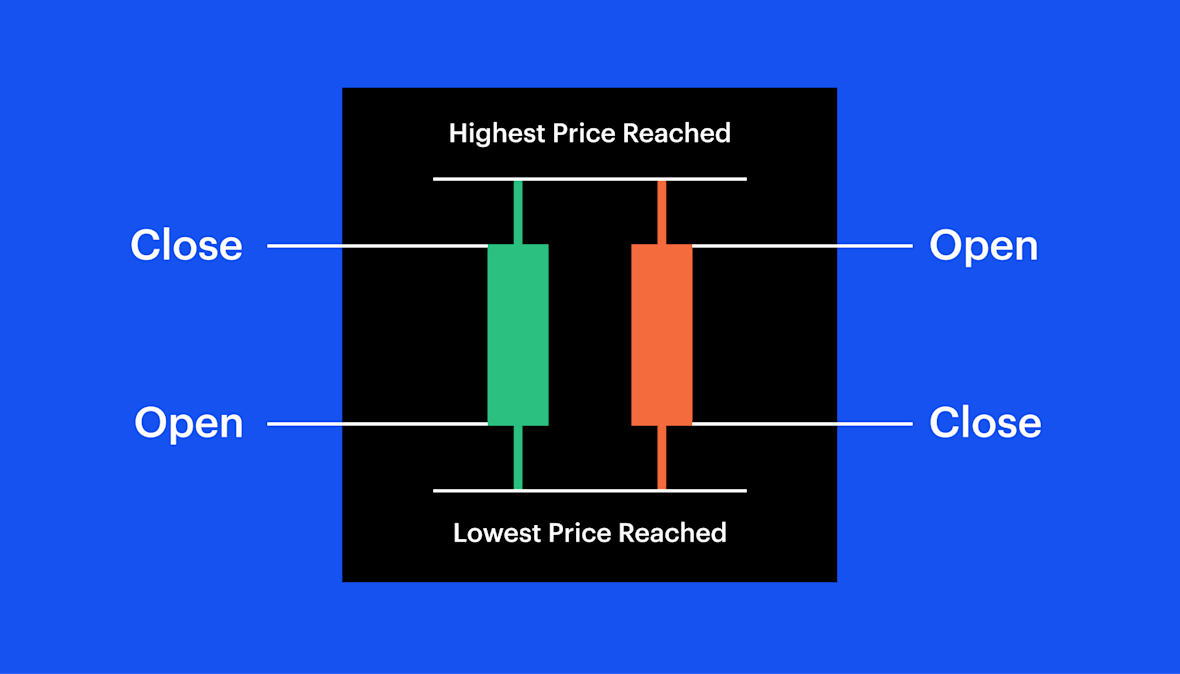
A candlestick chart tracking price action displays all the four price measures, which involves the opening, high, low, and closing prices, throughout a certain period. Each candlestick is made out of the following parts:
- Body: A rectangular section that opens and closes at the given prices.
- Colour: A green candle represents bullish momentum and a red candle bearish momentum.
- Wick (Shadow): The thin line that represent the high and low prices for an asset, extending above or below the candlestick body.
- Key Candlestick Patterns For Crypto Trading
- Bullish Patterns (Signals Quoting Price Increases)
Hammer
- The hammer candlestick pattern is characterized by a body or portion that has a long wick and a small body appearing at the high end of the range.
- It signals a hint of trend reversal after downtrends.
- The next candle closing higher would confirm this pattern.
Bullish Engulfing
- A bigger green candle completely covers the previous red candle.
- Shows strong buying activity and a potential change in the trend direction.
Morning Star
- A three-candle formation consisting of a large bearish candle followed by a small body candle, which is then succeeded by a bullish large candle.
- Indicates bullish reversal at the end of bearish trend.
Three White Soldiers
- Three back-to-back bullish candles with higher ends.
- Clear bullish continuation indicator.
- Bearish Patterns (Signals of Price Decrease)
Shooting Star
- A candle with small body and elongated upper shadow.
- Seen at the peak of a bullish trend and indicates price reversal.
Bearish Engulfing
- An even larger red candle that engulfs the previous green candle.
- Signifies strong selling activity and a possible downtrend.
Evening Star
- Large green candle followed by small body candle, and then a large red candle
- Depicts a bearish reversal on price after the preceding uptrend.
Three Black Crows
- Three continuous red candles that make lower lows.
- Clear indication of weakness in the market.
How to Use Candlestick Patterns to Predict Price Movements
- Identify Trends
- Determine if the market is on an uptrend, downtrend or sideways.
- Confirm the direction by using a moving average filter.
- Look for Reversal Patterns
- Hunt for bullish and bearish reversal patterns to plan for a change in the trend.
- Integrate patterns with the volume for confirmation.
- Validation through Technical Indicators
- Relative Strength Index (RSI): Used to evaluate whether a security is overbought or oversold.
- Moving Averages (SMA, EMA): Used to detect any emerging trends.
- MACD (Moving Average Convergence Divergence): Indicates overbought or oversold conditions.
- Determine the Times to Enter and Exit Trades
- Purchase after the bullish confirmation of the pattern.
- Sell or short after confirmation of the bearish pattern.
- Alleviate potential losses with stop-loss orders.
Final Thoughts
To forecast the movement of cryptocurrency values, candlestick charts are a vital part of traders’ arsenal. Understanding the fundamental candlestick patterns and using them alongside technical analysis helps traders make better decisions and increase profits. Start incrementing your analysis of these patterns on actual charts in order to improve your profits and always remain at the top in the ever-changing cryptocurrency environment.

